
The Old Days
As you know, diagrams and documentation play an important role in projects. They act as a compass to help developers understand the ideas of PMs, tech leads, or BAs, guide the required flow, and serve as evidence for reference when there are disputes about project requirements. A picture is worth a thousand words; sometimes a clear diagram can save hours of explanation and back-and-forth discussion.
Previously, when drawing diagrams for projects, I often used draw.io. For those who don’t know, it’s an online tool for drawing diagrams by drag and drop. But every time I needed to update a diagram, I had to drag and drop each box or arrow again, which was quite time-consuming. Until one day, a colleague introduced me to Mermaid, and everything changed…
Enlightened by Mermaid
According to the definition on the official website, Mermaid is a tool built on JavaScript that helps create diagrams and charts flexibly from text with syntax similar to Markdown.
Advantages
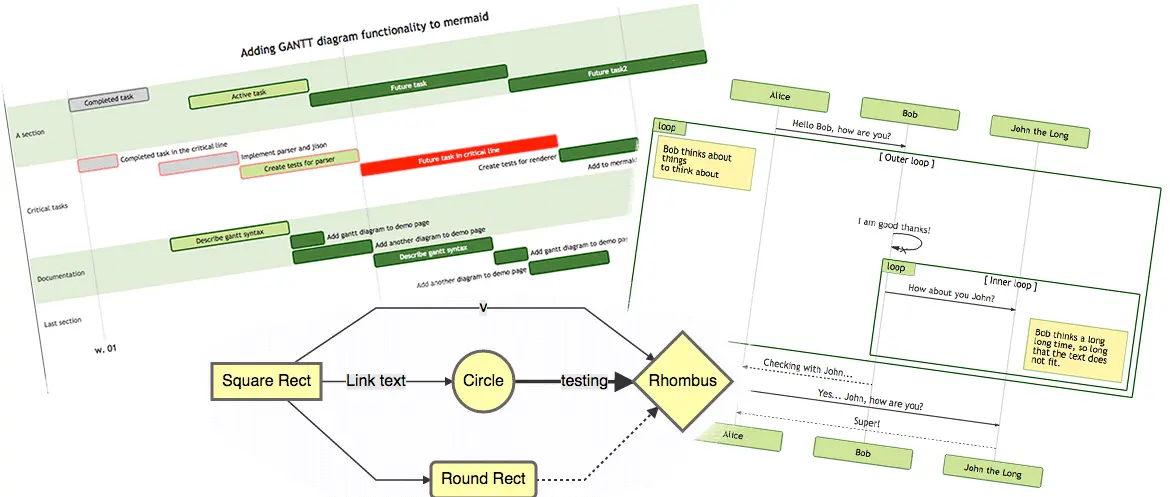
This is an open-source and completely free tool. It supports many popular types of diagrams and charts such as Flowchart, Sequence diagram, Class diagram, State diagram, Git graph…
The syntax is very simple and easy to learn. If you’re already familiar with Markdown, you just need to spend a little time to master it. Now, whenever project requirements change, you only need to edit a few lines of text and the diagram will be updated quickly.
For simple diagrams, you can use Mermaid Live Editor without installing anything. For company projects, Mermaid is already integrated with Notion or Atlassian products. If you want to use it locally, Mermaid works right in popular IDEs like Visual Studio Code or JetBrains family.
Comparison with PlantUML
There are other tools on the market that render diagrams from text like Mermaid, the most notable being PlantUML. Below is a comparison table for an overview.
| Criteria | Mermaid | PlantUML |
|---|---|---|
| GitHub Star (25/2/2024) | 65,400 | 9,300 |
| Diagram types | Flow, Sequence, Class, State, Git graph… | Sequence, Usecase, Class, Object, Activity, State… |
| Online support | Yes | Yes |
| Offline support | Yes | Yes |
| Pricing | Free | Free |
| Others | Easy to learn, user-friendly for beginners | Many extension libraries |
Installation on Visual Studio Code
Currently, in my project, the team is creating a separate project for diagrams, using Git for version control and Visual Studio Code for drawing.
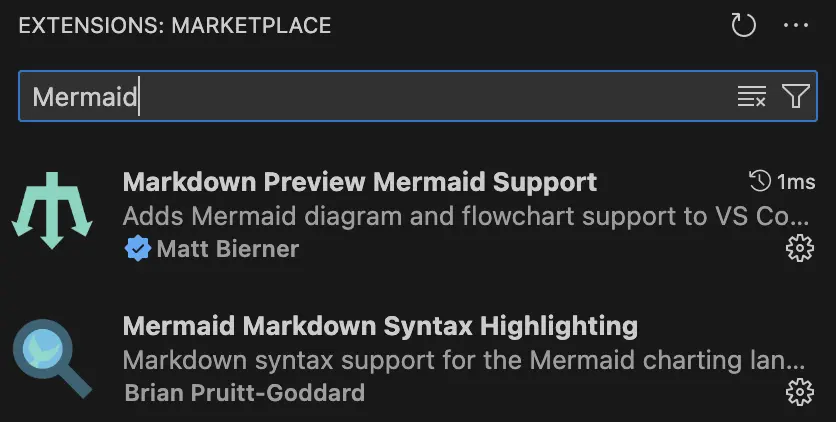
You only need to install 2 extensions: Markdown Preview Mermaid Support and Mermaid Markdown Syntax Highlighting on Visual Studio Code to get started.
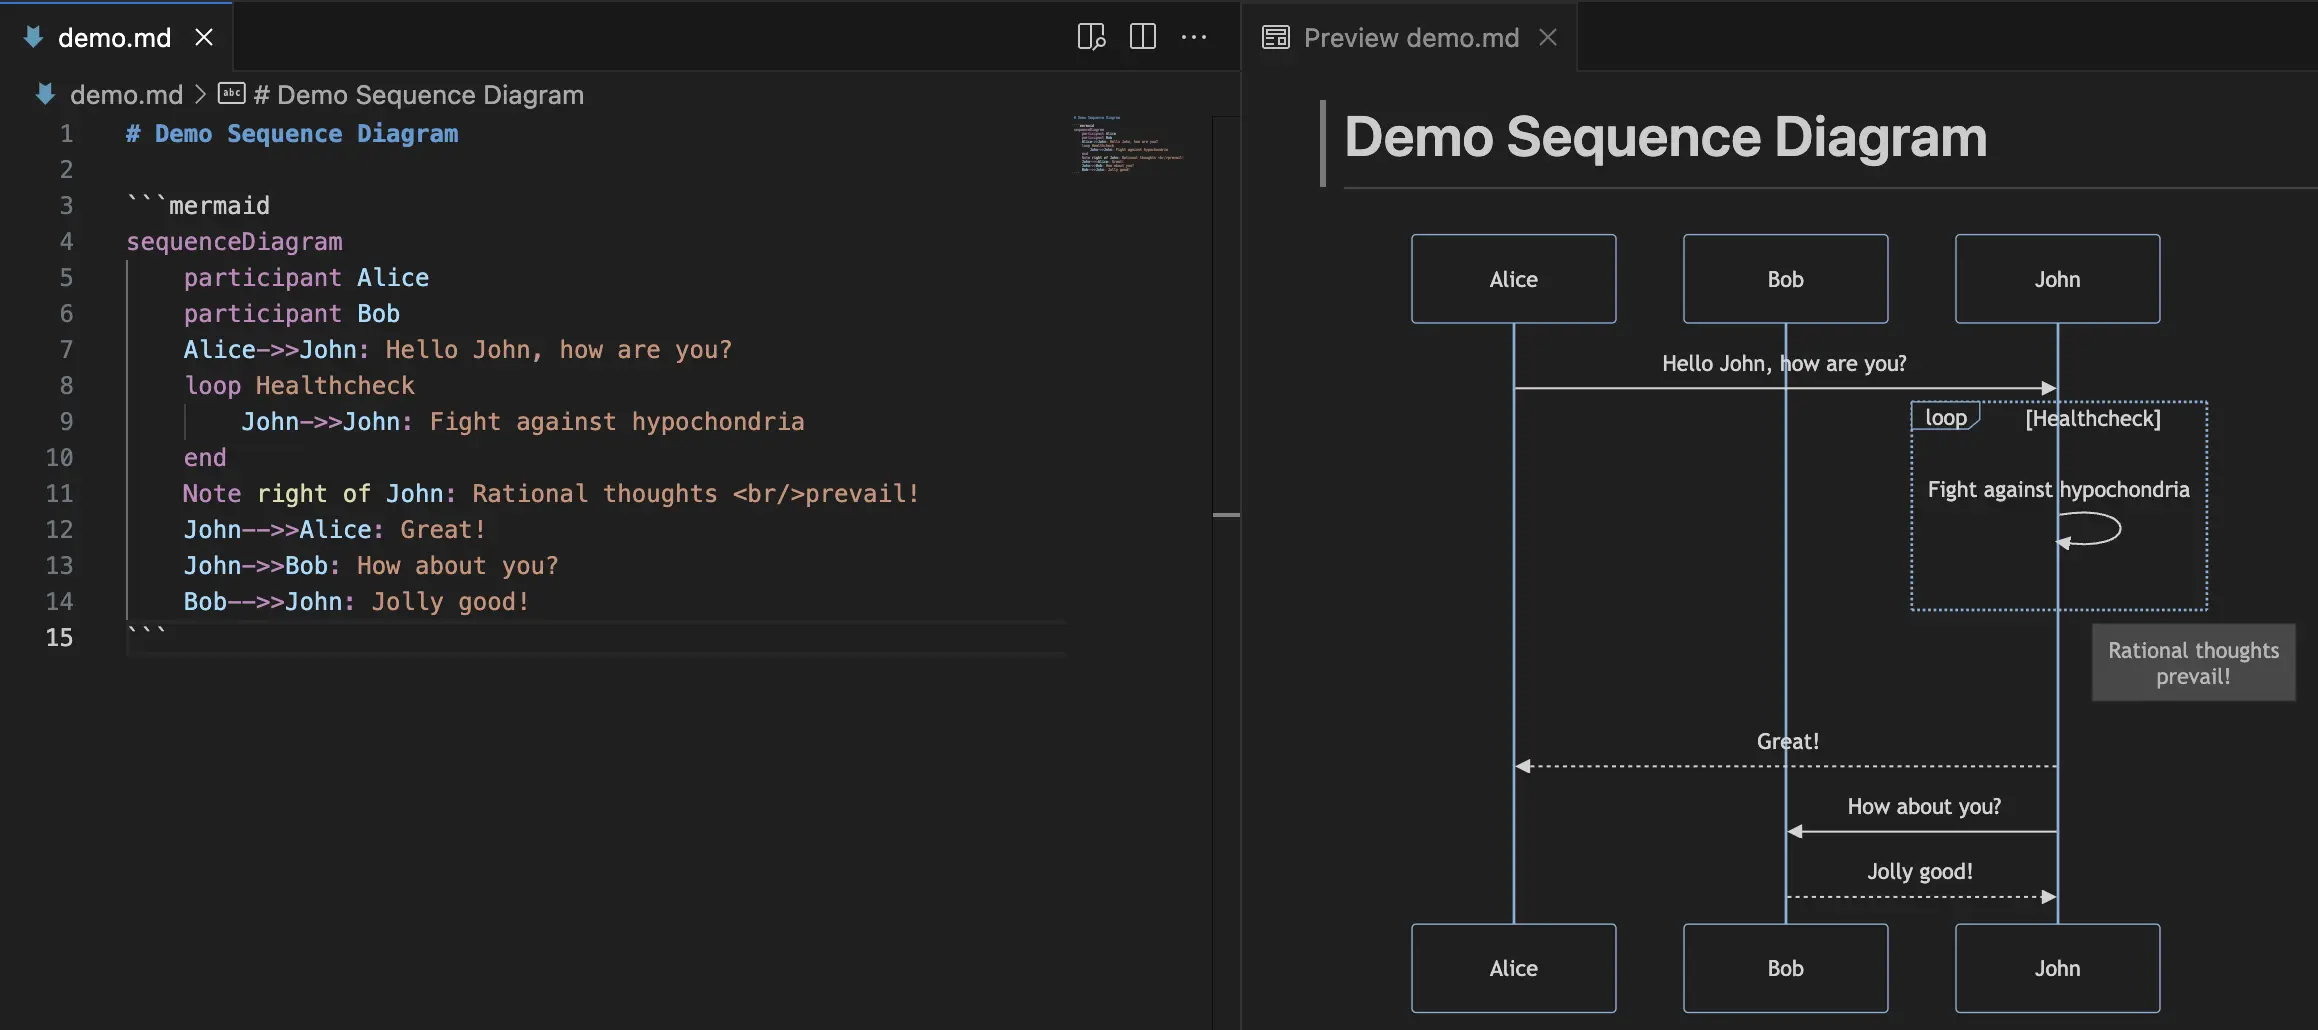
Whenever you need to draw a diagram, create a file with the .md extension and write the Mermaid syntax. You can click the Open Preview button in the top right corner to code and see the diagram updated live beside it. The result is as follows:
Just check out the example first, and I’ll go into detail about the syntax for each type of diagram in the next section.
Syntax for Common Diagrams
Flowchart
A flowchart consists of nodes and edges (which can be undirected edges or directed arrows). The Mermaid code will determine how to create the nodes and edges, with customizable edge types according to the drawer’s intention.
Sample syntax:
| |
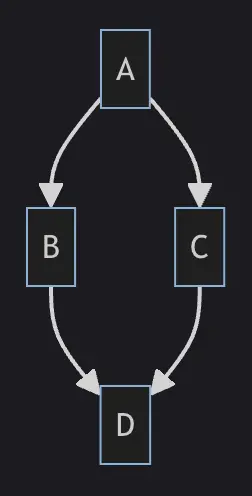
flowchart: the keyword for this type of chart (you can also usegraphinterchangeably).TD: the direction of the chart (top to down). Other options include:TB: top to bottom (same as top to down)BT: bottom to topRL: right to leftLR: left to right
A,B,C,D: the names of the nodes. Besides the default rectangle, you can also use other shapes like rounded rectangles, trapezoids, circles, etc.-->: directed edge type. There are also undirected, bidirectional types, and types with attached text…
Result:
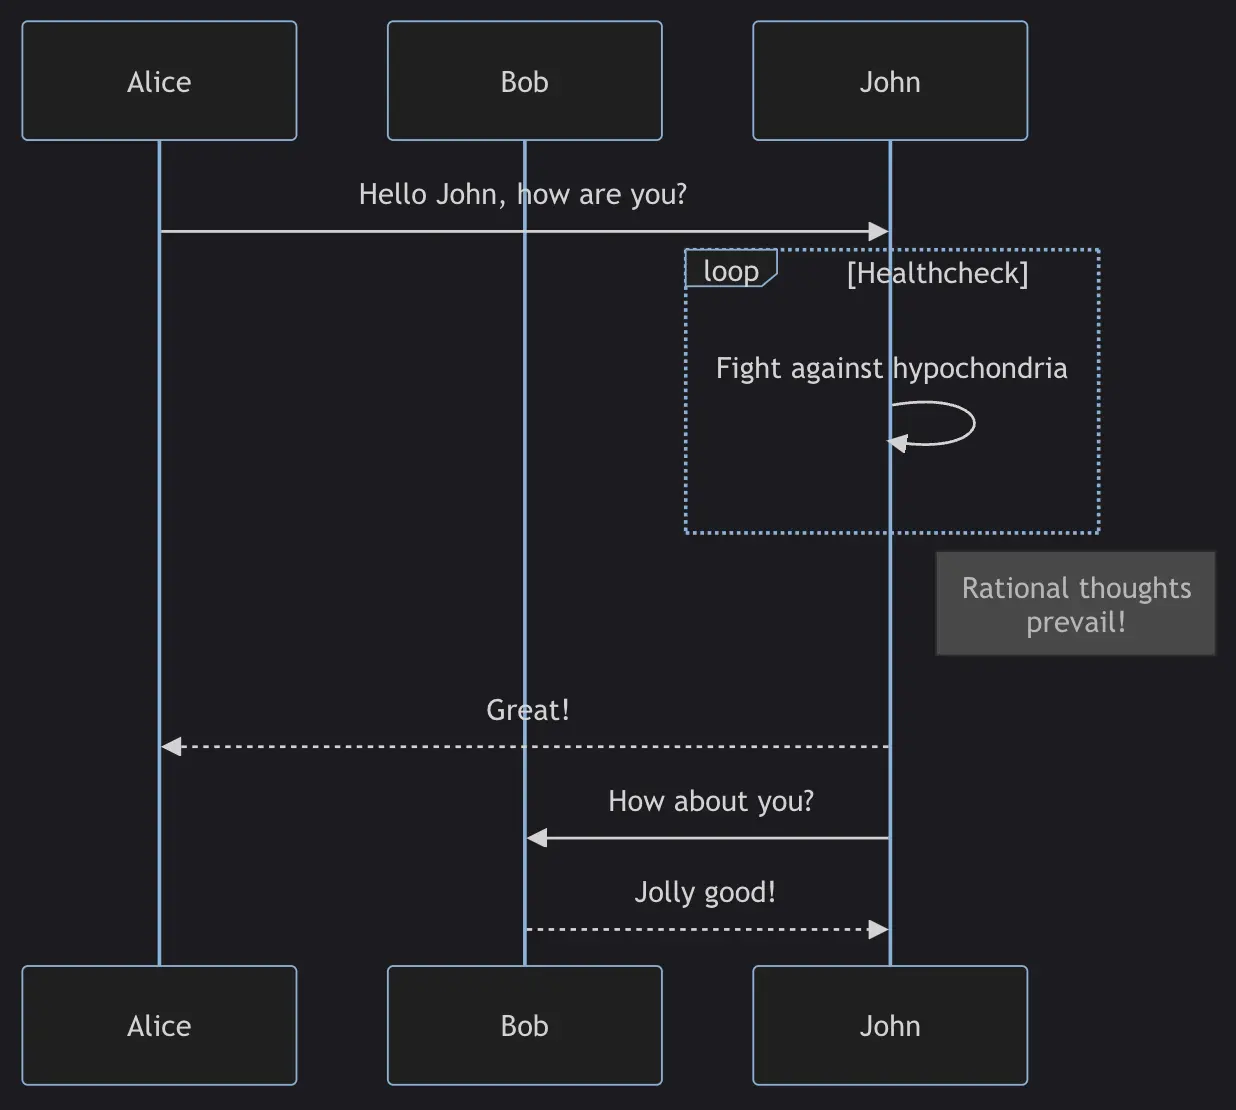
Sequence diagram
A sequence diagram is an interaction diagram that shows how different processes operate with each other and in what order.
Sample syntax:
| |
sequenceDiagram: the keyword for the diagram.participant: defines the participants in the diagram in sequential order. In this example, we have 3 participants:Alice,Bob, andJohn.- Each line defines the message between the participants.
->>,-->>: directed message types with solid and dashed lines.
Result:
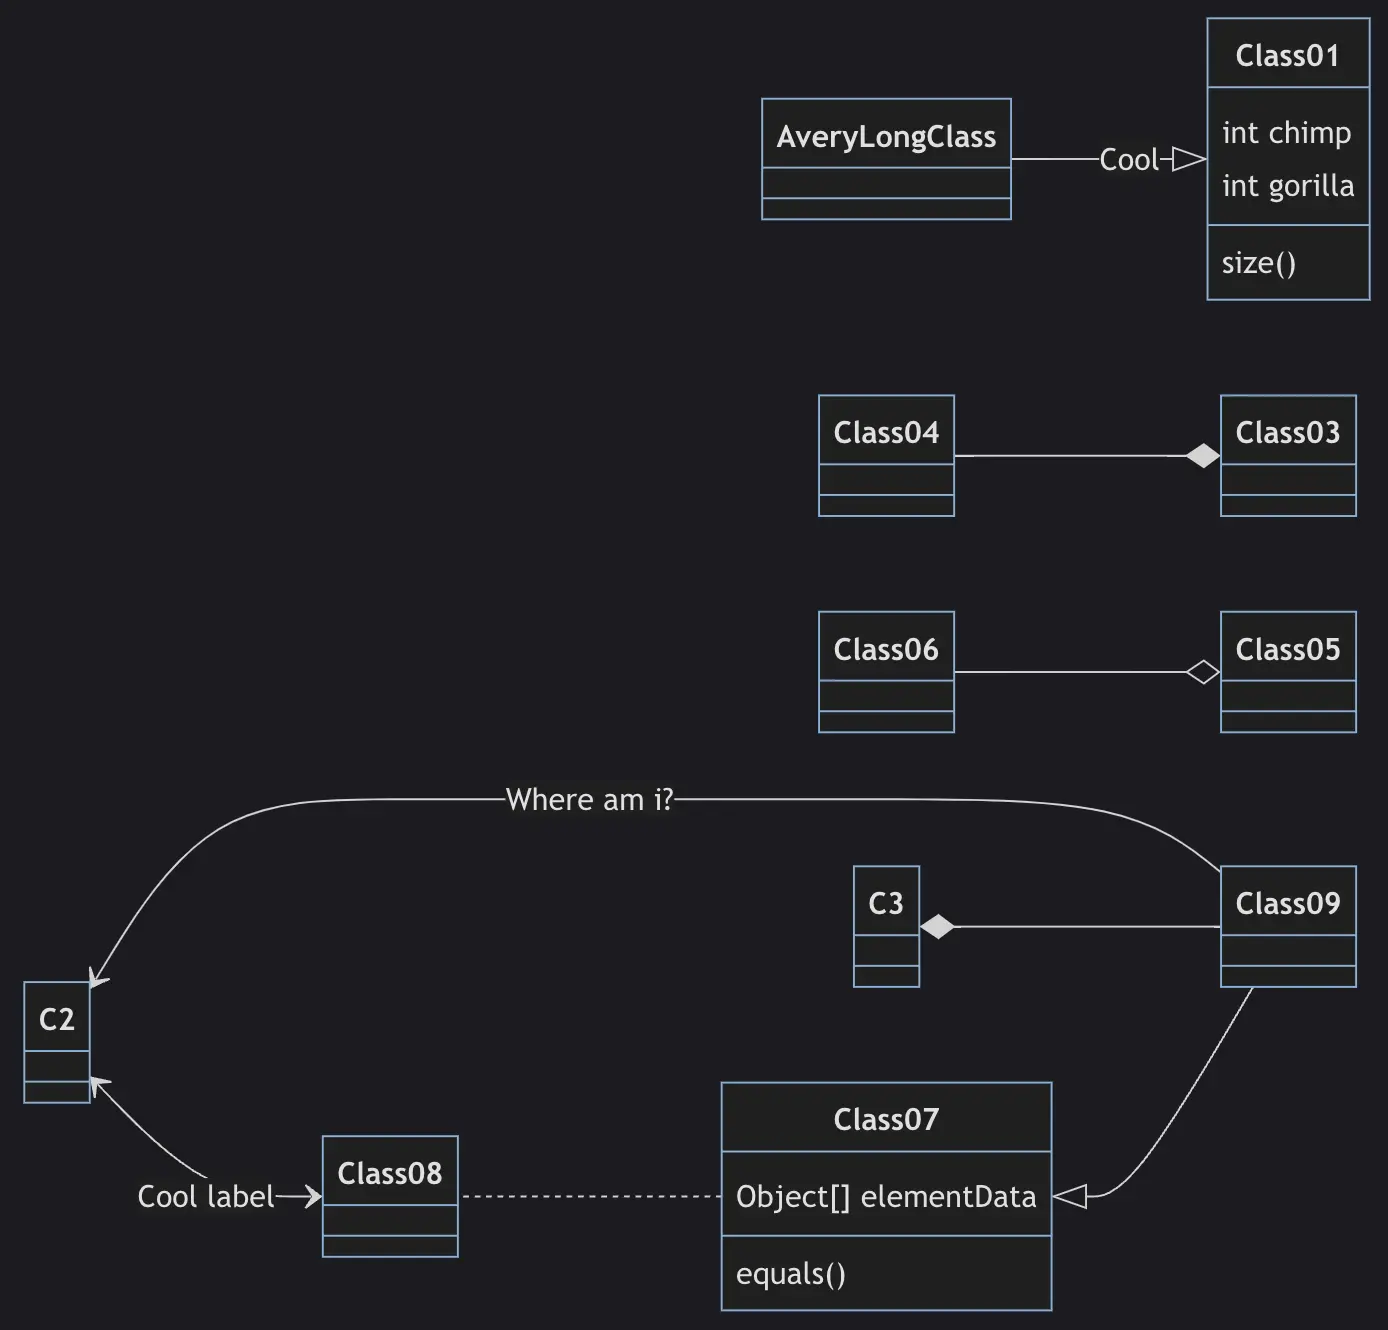
Class diagram
A class diagram in UML (Unified Modeling Language) is a type of static structure diagram that describes the structure of a system by showing the classes of the system, their attributes, operations (or methods), and the relationships between objects.
Sample syntax:
| |
classDiagram: the keyword for the diagram.chimp,gorilla,elementData: attributes of the classes.size(),equals(): methods of the classes.*--,o--: relationships between classes.
Result:
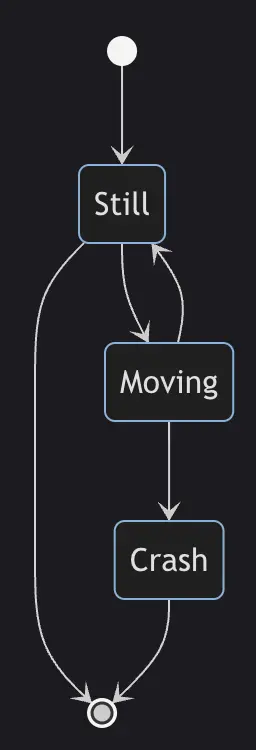
State diagram
A state diagram is a type of diagram that describes the behavior of a system, showing some of the system’s states.
Sample syntax:
| |
stateDiagram: the keyword for the diagram.[*]: start or end point.Still,Moving,Crash: the states of the system.-->: state transition steps.
Result:
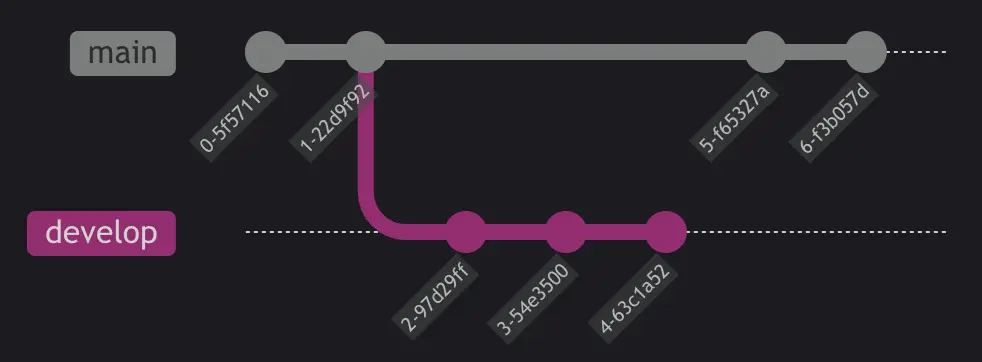
Git graph
A git graph illustrates git commits and git actions (commands) on different branches.
Sample syntax:
| |
gitGraph: the keyword for the graph.commit: creates a new commit on the current branch.branch: creates and switches to a new branch, setting it as the current branch.checkout: checks out an existing branch and sets it as the current branch.merge: merges a branch into the current branch.
Result:
Conclusion
Mermaid is truly powerful and flexible; it provides us with many options to draw various types of diagrams. However, in this short article, I couldn’t introduce all those options to you. If you need more details, you can refer to the Mermaid documentation linked in each title section. I hope you now have an overview of Mermaid and can apply it in your projects or your team’s projects, helping save time and effort.